The diagram below represent
ECONOMICS
JAMB 2023
The diagram below represent
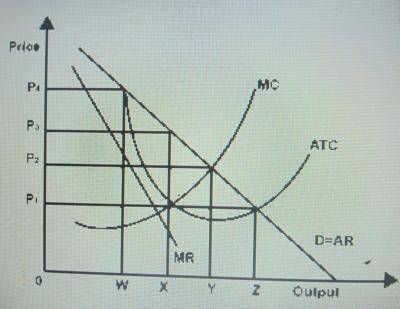
- A. perfect competition
- B. monopoly
- C. demand curve
- D. competitive market
Correct Answer: B. monopoly
Post an Explanation Or Report an Error
If you see any wrong question or answer, please leave a comment below and we'll take a look. If you doubt why the selected answer is correct or need additional more details? Please drop a comment or Contact us directly. Your email address will not be published. Required fields are marked *