The diagram below shows a velocity time graph representing the motion of a car. Find...
PHYSICS
JAMB 1993
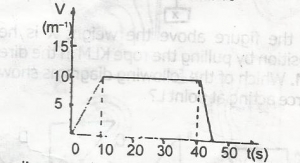
The diagram below shows a velocity time graph representing the motion of a car. Find the total distance covered during the acceleration and retardation of the motion
- A. 75m
- B. 150m
- C. 300m
- D. 375m
Correct Answer: D. 375m
Explanation
Total Distance covered is the Area of the Trapezium
Area of the Trapezium = \(\frac{1}{2}\) X ( sum of parallel sides ) X height
= \(\frac{1}{2}\) X ( 30 + 45 ) X 10
: S = 375m
Post an Explanation Or Report an Error
If you see any wrong question or answer, please leave a comment below and we'll take a look. If you doubt why the selected answer is correct or need additional more details? Please drop a comment or Contact us directly. Your email address will not be published. Required fields are marked *