In the diagram below, the marginal rate of substitution of X for Y, for a...
ECONOMICS
JAMB 2002
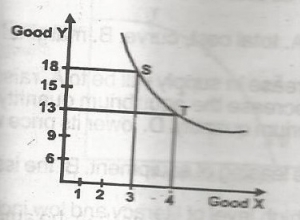
In the diagram below, the marginal rate of substitution of X for Y, for a movement from S to T is
- A. 13:3
- B. 1:5
- C. 18:4
- D. 5:1
Correct Answer: D. 5:1
Explanation
To produce 18 units of Y, at point S, 3 units of X was produced at the same point S. A movement along the production chart from point S to T, the firm gave up 5 units of Y to produce 4 units of X. This means that the firm gave up 5 units of product Y to produce 1 additional unit of X.
The ratio of substitution is 5:1
Post an Explanation Or Report an Error
If you see any wrong question or answer, please leave a comment below and we'll take a look. If you doubt why the selected answer is correct or need additional more details? Please drop a comment or Contact us directly. Your email address will not be published. Required fields are marked *