Mathematics Past Questions And Answers
Make 'n' the subject of the formula if w = \(\frac{v(2 + cn)}{1 - cn}\)
- A. \(\frac{1}{c}(\frac{w - 2v}{v + w})\)
- B. \(\frac{1}{c}(\frac{w - 2v}{v - w})\)
- C. \(\frac{1}{c}(\frac{w + 2v}{v - w})\)
- D. \(\frac{1}{c}(\frac{w + 2v}{v + w})\)
What is the equation of the curve?
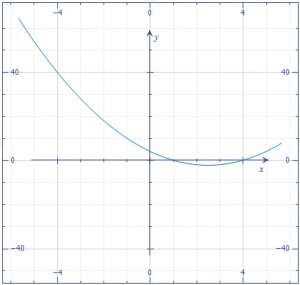
- A. \(y=x^2+6x+4\)
- B. \(y=x^2-5x-4\)
- C. \(y=x^2-5x+4\)
- D. \(y=x^2+5x-4\)
(a) It takes 8 students two- thirds of an hour to fill 12 tanks with water. How many tanks of water will 4 students fill in one- third of an hour at the same rate?
(b) A chord, 20 cm long, is 12 cm from the centre of the circle. Calculate, correct to one decimal place, the :
(i) angle subtended by the chord at the centre of the circle;
(ii) perimeter of the minor segment cut off by the chord. [Take \(\pi = 3.142\)].
View Discussion (0)WAEC 2017 THEORY.jpg)
Which of the following sets is equivalent to \((P \cup Q) \cap (P \cup Q')\)?
- A. P
- B. \(P \cap Q\)
- C. \(P \cup Q\)
- D. \(\emptyset\)
.jpg)
The pie chart shows the distribution of marks scored by 200 pupils in a test.
(a) How many pupils scored : (i) between 41 and 50 marks? ; (ii) above 80 marks ?
(b) What fraction of the pupils scored at most 50 marks?
(c) What is the modal class?
View Discussion (0)WAEC 2000 THEORYA cylindrical pipe 50m long with radius 7m has one end open. What is the total surface area of the pipe?
- A. 749πm2
- B. 700πm2
- C. 350πm2
- D. 98πm2
Simplify \(\frac{2-18m^2}{1+3m}\)
- A. \(2(1+3m)\)
- B. \(2(1+3m^2)\)
- C. \(2(1-3m)\)
- D. \(2(1-3m^2)\)
If \(f : x → 2 tan x\) and \(g : x → √(x^2 + 8), find ( g o f )(45^o)\)
- A. 4
- B. 2√3
- C. 6
- D. 3√2
A trader made a loss of 10% on a motorcycle he sold for N54,000: How much should he have sold the motorcycle to make a gain of 10%?
- a. N60,000
- b. N62,000
- c. N64,000
- d. N66,000
(a)The table shows the distribution of heights ( cm ) of 60 seedlings in a vegetable garden.
| Heights(cm) | 0.1 - 0.3 | 0.4 - 0.6 | 0.7 - 0.9 | 1.0 - 1.4 | 1.5 - 1.9 | 2.0 - 22 | 2.3 - 2.5 |
| Frequency | 6 | 9 | 12 | 15 | 3 | 6 | 9 |
Draw a histogram for the distribution.
(b) The table shows the distribution of heights ( cm ) of 60 seedlings in a vegetable garden.
| Heights(cm) | 0.1 - 0.3 | 0.4 - 0.6 | 0.7 - 0.9 | 1.0 - 1.4 | 1.5 - 1.9 | 2.0 - 2.2 | 2.3 - 2.5 |
| Frequency | 6 | 9 | 12 | 15 | 3 | 6 | 9 |
Use the histogram to estimate the modal height of the seedlings.
View Discussion (0)WAEC 2023 THEORY