The diagram below represents the stress-strain graph of a loaded wire. Which of these statements...
PHYSICS
JAMB 2019
The diagram below represents the stress-strain graph of a loaded wire. Which of these statements is correct?
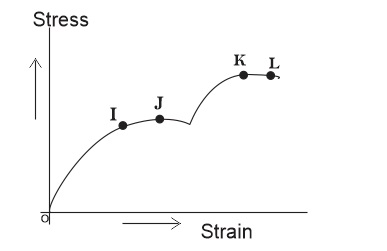
- A. At J, the wire becomes plastic
- B. J is the yield point
- C. L is the elastic limit
- D. At K, the wire breaks
Correct Answer: B. J is the yield point
Post an Explanation Or Report an Error
If you see any wrong question or answer, please leave a comment below and we'll take a look. If you doubt why the selected answer is correct or need additional more details? Please drop a comment or Contact us directly. Your email address will not be published. Required fields are marked *