The curve depicts titration between
CHEMISTRY
JAMB 2016
The curve depicts titration between
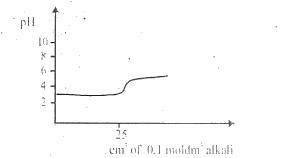
- A) Strong acid and strong base
- B) Strong acid and weak base
- C) Weak acid and weak base
- D) Weak acid and strong base
Correct Answer: C) Weak acid and weak base
Post an Explanation Or Report an Error
If you see any wrong question or answer, please leave a comment below and we'll take a look. If you doubt why the selected answer is correct or need additional more details? Please drop a comment or Contact us directly. Your email address will not be published. Required fields are marked *