The diagram below illustrates a velocity-time graph. Determine the distance between X and Y.
PHYSICS
WAEC 2023
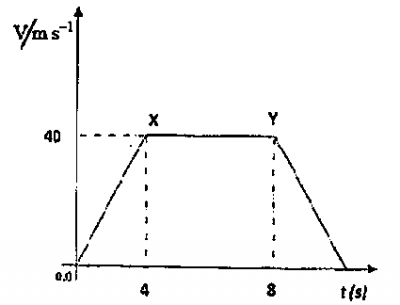
The diagram below illustrates a velocity-time graph. Determine the distance between X and Y.
- A. 80.0m
- B. 160.0m
- C. 40.0m
- D. 10.0m
Correct Answer: B. 160.0m
Explanation
Distance between X and Y is the area of rectangular portion of the velocity-time graph. XY = 40
Post an Explanation Or Report an Error
If you see any wrong question or answer, please leave a comment below and we'll take a look. If you doubt why the selected answer is correct or need additional more details? Please drop a comment or Contact us directly. Your email address will not be published. Required fields are marked *