The bar chart represents the distribution of marks scored by students in an economics examination....
MATHEMATICS
WAEC 2023
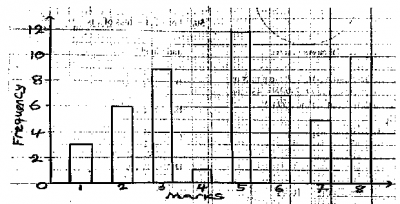
The bar chart represents the distribution of marks scored by students in an economics examination. Use the bar chart to answer questions 30 to 32
If the failed mark was 4, what is the probability that a student selected at random passed?
- A. 0.36
- B. 0.74
- C. 0.52
- D. 0.64
Correct Answer: D. 0.64
Explanation
Total number of students = total frequency = 3 + 6 + 9 + 1 + 12 + 7 + 5 + 10 = 53
Since the failed mark was 4,
Total number of students that passed = 12 + 7 + 5 + 10 = 34
Pr( passed) = \(\frac{34}{53}\) = 0. 64
Post an Explanation Or Report an Error
If you see any wrong question or answer, please leave a comment below and we'll take a look. If you doubt why the selected answer is correct or need additional more details? Please drop a comment or Contact us directly. Your email address will not be published. Required fields are marked *