Which inequality describes the graph below?
MATHEMATICS
JAMB 2023
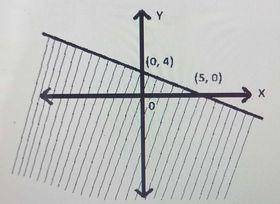
Which inequality describes the graph below?
- A. \(4y + 5x ≥ 20\)
- B. \(5y + 4x ≤ 20\)
- C. \(4y + 5x ≤ 20\)
- D. \(5y + 4x ≥ 20\)
Correct Answer: B. \(5y + 4x ≤ 20\)
Explanation
First, we find the equation of the boundary line using the two intercepts.The slope is
m = \(\frac{4 - 0}{0 - 5} = {4}{5}\)
The y-intercept is 4
The slope-intercept form of the equation is therefore
y = -\(\frac{4}{5} x + 4\)
\(\implies y + \frac{4}{5} x = 4\)
Multiply both sides by \(\frac{5}{4}\)
\(\implies\frac{5}{4}(y +\frac{4}{5} x) = 4\times\frac{5}{4}\)
\(\implies\frac{5}{4} y + x = 5\)
Multiply both sides by 4
⇒ \(5y + 4x = 20\)
The inequality is therefore either \(5y + 4x ≤ 20\) or \(5y + 4x ≥ 20.\)
Using the test point (0, 0) -The origin
⇒ 5(0) + 4(0) ≤ 20
⇒ 0 ≤ 20 (True)
∴ The inequality is \(5y + 4x ≤ 20\)
Post an Explanation Or Report an Error
If you see any wrong question or answer, please leave a comment below and we'll take a look. If you doubt why the selected answer is correct or need additional more details? Please drop a comment or Contact us directly. Your email address will not be published. Required fields are marked *