The graph above depicts the performance ratings of two sports teams A and B in...
MATHEMATICS
JAMB 2023
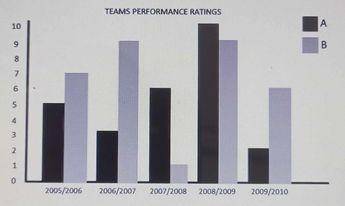
The graph above depicts the performance ratings of two sports teams A and B in five different seasons
In the last five seasons, what was the difference in the average performance ratings between Team B and Team A?
- A. 1.2
- B. 6.4
- C. 4.6
- D. 1.8
Correct Answer: A. 1.2
Explanation
Average performance rating of Team B = \(\frac{7+9+1+9+6}{5} = \frac{32}{5}\) = 6.4
Average performance rating of Team A = \(\frac{5+3+6+10+2}{5} = \frac{26}{5}\) = 5.2
∴ The difference in the average performance ratings between Team B and Team A = 6.4 - 5.2 = 1.2
Post an Explanation Or Report an Error
If you see any wrong question or answer, please leave a comment below and we'll take a look. If you doubt why the selected answer is correct or need additional more details? Please drop a comment or Contact us directly. Your email address will not be published. Required fields are marked *