In the diagram below, which of the curves represents the evolution of oxygen with time...
CHEMISTRY
JAMB 2009
In the diagram below, which of the curves represents the evolution of oxygen with time in the equation 2KClO3(s) → 2KCl(s) + 3O2(g)?
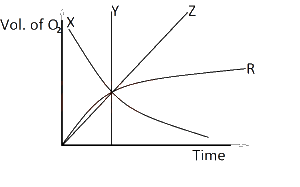
- A) X
- B) Y
- C) Z
- D) R
Correct Answer: C) Z
Post an Explanation Or Report an Error
If you see any wrong question or answer, please leave a comment below and we'll take a look. If you doubt why the selected answer is correct or need additional more details? Please drop a comment or Contact us directly. Your email address will not be published. Required fields are marked *