The diagram below is a velocity- time graph of a moving object. Calculate the distance...
FURTHER MATHEMATICS
WAEC 2012
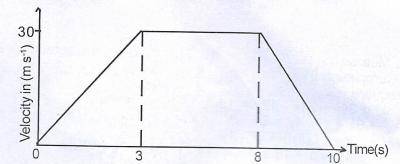
The diagram below is a velocity- time graph of a moving object. Calculate the distance travelled when the acceleration is zero.
- A. 300 m
- B. 90 m
- C. 150 m
- D. 210 m
Correct Answer: C. 150 m
Explanation
The acceleration is between the times 3 secs and 8 secs.
Distance = \(velocity \times time\)
= \(30 \times (8 - 3) = 30 \times 5\)
= \(150 m\)
Post an Explanation Or Report an Error
If you see any wrong question or answer, please leave a comment below and we'll take a look. If you doubt why the selected answer is correct or need additional more details? Please drop a comment or Contact us directly. Your email address will not be published. Required fields are marked *