The graph best_____________
AGRICULTURE
WAEC 2019
The graph best_____________
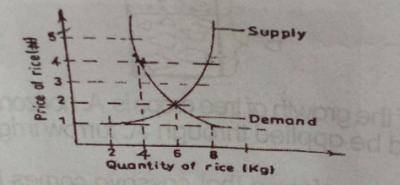
- A. shows an increase in the supply of rice
- B. describes a shift in the demand for rice
- C. describes the equilibrium price for rice
- D. shows that the demand for rice exceeds supply
Correct Answer: C. describes the equilibrium price for rice
Post an Explanation Or Report an Error
If you see any wrong question or answer, please leave a comment below and we'll take a look. If you doubt why the selected answer is correct or need additional more details? Please drop a comment or Contact us directly. Your email address will not be published. Required fields are marked *