The diagram given, represents the graph of stress against strain for an elastic wire. The...
PHYSICS
WAEC 2016
The diagram given, represents the graph of stress against strain for an elastic wire. The point Q on the graph is the
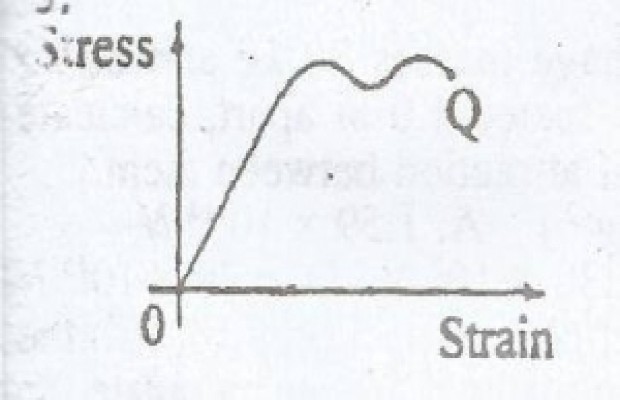
- A. elastic limit
- B. breaking point
- C. yield point
- D. proportional limit
Correct Answer: B. breaking point
Post an Explanation Or Report an Error
If you see any wrong question or answer, please leave a comment below and we'll take a look. If you doubt why the selected answer is correct or need additional more details? Please drop a comment or Contact us directly. Your email address will not be published. Required fields are marked *