The figure is a pie chart which represents the expenditure of a family in a...
MATHEMATICS
WAEC 2016
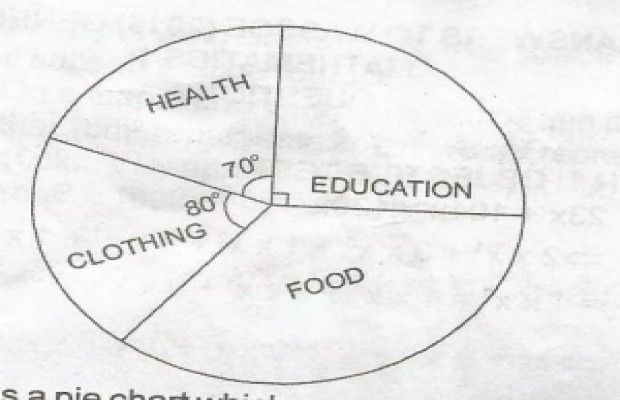
The figure is a pie chart which represents the expenditure of a family in a year. If the total income of the family was Le 10,800,000.00, how much was spent on food?
- A. Le 2,250,000.00
- B. Le 22,700,000.00
- C. Le 3,600,000.00
- D. Le 4,500,000.00
Correct Answer: C. Le 3,600,000.00
Explanation
sectoral angle representing food
= 360o - (80 + 70 + 90)o
= 120o
Amount spent on food
= \(\frac{\tect{sectoral angle}}{360^o}\) x Le 10,800,000
= Le 3,600,000
Post an Explanation Or Report an Error
If you see any wrong question or answer, please leave a comment below and we'll take a look. If you doubt why the selected answer is correct or need additional more details? Please drop a comment or Contact us directly. Your email address will not be published. Required fields are marked *