The bar chart shows the frequency distribution of marks scored by students in a class...
MATHEMATICS
WAEC 2012
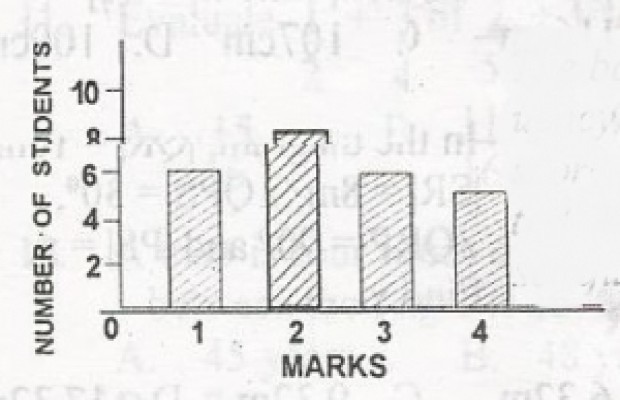
The bar chart shows the frequency distribution of marks scored by students in a class test. What is the median of the distribution?
- A. 2
- B. 4
- C. 6
- D. 8
Correct Answer: A. 2
Explanation
median = (\(\frac{N + 1}{2}\))th = (\(\frac{25 + 1}{2}\))th
= \(\frac{26th}{2}\)
= 13th
the 13th is 2
Post an Explanation Or Report an Error
If you see any wrong question or answer, please leave a comment below and we'll take a look. If you doubt why the selected answer is correct or need additional more details? Please drop a comment or Contact us directly. Your email address will not be published. Required fields are marked *