The above diagram showing the maximum possible combination of commodities X and Y produced in...
ECONOMICS
JAMB 1993
The above diagram showing the maximum possible combination of commodities X and Y produced in Nigeria is called the
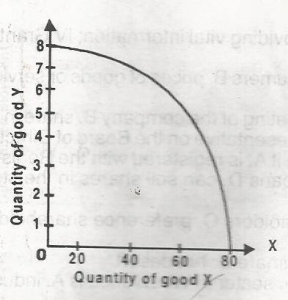
- A. Production indicator
- B. Maximum production curve
- C. Production possibility curve
- D. Total output curve
Correct Answer: C. Production possibility curve
Post an Explanation Or Report an Error
If you see any wrong question or answer, please leave a comment below and we'll take a look. If you doubt why the selected answer is correct or need additional more details? Please drop a comment or Contact us directly. Your email address will not be published. Required fields are marked *