Which of the following graphs represents the price-quantity relationship between tea and lemon, if they...
ECONOMICS
JAMB 1990
Which of the following graphs represents the price-quantity relationship between tea and lemon, if they are perfect complements? choose the answer from the option below
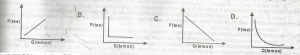
- A. A
- B. B
- C. C
- D. D
Correct Answer: B. B
Post an Explanation Or Report an Error
If you see any wrong question or answer, please leave a comment below and we'll take a look. If you doubt why the selected answer is correct or need additional more details? Please drop a comment or Contact us directly. Your email address will not be published. Required fields are marked *