The table below shows the budgetary allocation of a country to selected sectors of the...
The table below shows the budgetary allocation of a country to selected sectors of the economy in a particular year. Study the table carefully and answer the questions that follow.
| Sectors | Amount ( $ Million) |
| Education | 6,250 |
| Mining | 2,150 |
| Agriculture | 4,300 |
| Communication | 2,400 |
| Health | 2,900 |
(a) Present the above information contained in the table in the form of a pie chart. (Show your workings clearly). [12 marks]
(b) Distinguish between a budget surplus and a budget deficit. [8 marks]
Explanation
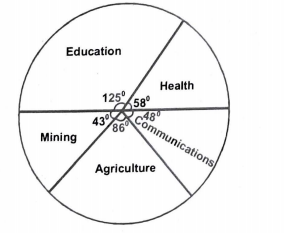
(a) Total amount budgeted: $6,250 + $2,150 + $4,300 + $2,400 + $2,900 = $18,000.
Education = \(\frac{6,250}{18,000}\) x 360 = 125°
Mining = \(\frac{2,150}{18,000}\) x 360 = 43°
Agriculture = \(\frac{4,300}{18,000}\) x 360 = 86°
Communication = \(\frac{2,400}{18,000}\) x 360 = 48°
Health = \(\frac{2,900}{18,000}\) x 360 = 58°
A pie chart showing budgetary allocations of a country for selected sectors of the economy.
(b) A budget surplus occurs when a governments planned revenue is more that its planned expenditure.
While a budget deficit occurs when the planned expenditure is more than the planned revenue.