Which of the following could be the inequality illustrated in the sketch graph below?
MATHEMATICS
WAEC 1995
Which of the following could be the inequality illustrated in the sketch graph below?
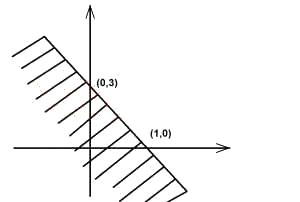
- A. y≥2x+3
- B. y≤-3x+3
- C. y< 3x+2
- D. y≤x +3
Correct Answer: B. y≤-3x+3
Explanation
Gradient of the line = \(\frac{3 - 0}{0 - 1}\)
= -3
y = -3x + b.
Using (1,0), we have
0 = -3(1) + b
0 = -3 + b
b = 3
y = -3x + 3
\(\therefore\) The graph illustrates y \(\leq\) -3x + 3.
Post an Explanation Or Report an Error
If you see any wrong question or answer, please leave a comment below and we'll take a look. If you doubt why the selected answer is correct or need additional more details? Please drop a comment or Contact us directly. Your email address will not be published. Required fields are marked *