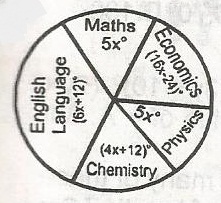
The pie chart below shows the statistical distribution of 80 students in five subjects in
MATHEMATICS
JAMB 2013
The pie chart below shows the statistical distribution of 80 students in five subjects in an examination. Calculate how many student offer Mathematics.
- A. 30
- B. 11
- C. 50
- D. 20
Correct Answer: B. 11
Post an Explanation Or Report an Error
If you see any wrong question or answer, please leave a comment below and we'll take a look. If you doubt why the selected answer is correct or need additional more details? Please drop a comment or Contact us directly. Your email address will not be published. Required fields are marked *