Waec 2009 Economics Past Questions And Answers
If an increase in earning leads to more of of a commodity being demanded, the good is said to have
- A. positive income elasticity
- B. negative income elasticity
- C. positive cross elasticity
- D. negative cross elasticity
What accounts for the ‘U-shaped’ of the short run average cost (AC) curve?
- A. the law of variable proportions
- B. increasing returns to scale
- C. decreasing use of inputs
- D. change output during the production period
The interaction of supply and demands for labour determines
- A. production
- B. income
- C. wage
- D. profits
which of the following sector is most capital intensive?
- A. insurance
- B. petroleum
- C. commerce
- D. tourism
(a) Define labour [4 marks]
(b) Give four factors that affect the efficiency of labour in your country. [16 marks]
View Discussion (0)WAEC 2009 THEORYGovernment fixing of prices below the equilibrium point is aimed at protecting the
- A. sellers
- B. industries
- C. distributors
- D. consumers
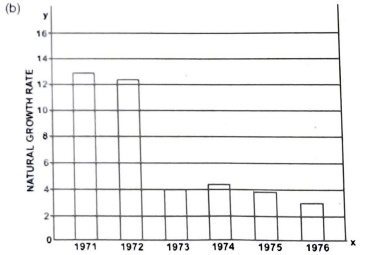
The table below shows the natural growth gowth rate of the population of country N over a period of time. Use the information contained in the table to answer the following questions.
| Year | Birth Rate per '000 | Death Rate per '000 | Natural Growth Rate |
| 1971 | 45 | 32 | L |
| 1972 | 39 | P | 12.50 |
| 1973 | 26 | 22 | Q |
| 1974 | R | 22.50 | 4.50 |
| 1975 | 26.50 | 22.50 | S |
| 1976 | 20.50 | T | 3.00 |
(a) Determine L. P, Q, R, S and T. [6 marks]
(b) With the use of a bar chart, graphically present the changes in the natural growth rate over the years. (Use of graph sheet is essential) [8 marks]
(c) Outline any three reasons for changes in birth rate. [6 marks]
The relationship between Marginal Product (MP) and Average Product (AP) is such that they are equal when
- A. average product is maximum
- B. Average product is minimum
- C. Marginal Product is maximum
- D. Marginal Product is increasing
The need for development planning arises largely from the fact that
- A. aggregate savings exceeds aggregate consumption
- B. aggregate consumption equals aggregate savings
- C. productive resource are in excess of the demand for them
- D. productive resource are scarce relative to the demand for them
The type of demand that exist between torchlight and battery is
- A. competitive demand
- B. complemetary demand
- C. composite demand
- D. joint demand