Economics Past Questions And Answers
Given that demand and price remain unchanged an outward shift of the supply curve will lead to
- A. hoarding
- B. excess supply
- C. excess demand
- D. a blank market
An increase in the discount rate is an indication of a central bank's intention to pursue?
- A. an expansionary monetary policy
- B. a disciplined monetary policy
- C. a dynamic monetary policy
- D. a contractionary monetary policy
(a) Explain how the Central Bank controls money supply through the use of: (i) open market operation (ii) bank rate.
(b) Outline four functions performed by the Central Bank of your country.
View Discussion (0)WAEC 2021 THEORYHow can a huge national debt affect the economy of a country?
View Discussion (0)WAEC 2002 THEORYIf petrol is no longer needed to produce energy, then demand for crude oil
- A. will increase
- B. will remain constant
- C. may be limited to chemical industries
- D. will make producing countries richer
a. Define a joint venture.
b. identify any three merits of a private company over a partnership.
c. State any three sources of finance to a public enterprise
View Discussion (0)WAEC 2015 THEORYThe type of cost which has to be covered for a firm to continue production in the short-run is the?
- A. overhead cost
- B. fixed cost
- C. marginal cost
- D. average variable cost
From the table below, the total utility for the individual who consumes 3 units of commodity X is
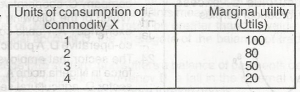
- A. 50 units
- B. 150 units
- C. 230 units
- D. 250 units
Patents are examples of
- A. natural barriers to entry
- B. legal barriers to entry
- C. illegal barriers to entry
- D. unnatural barriers to entry
A cumulative frequency graph is
- A. a histogram
- B. an ogive
- C. a bar chart
- D. a pie chart